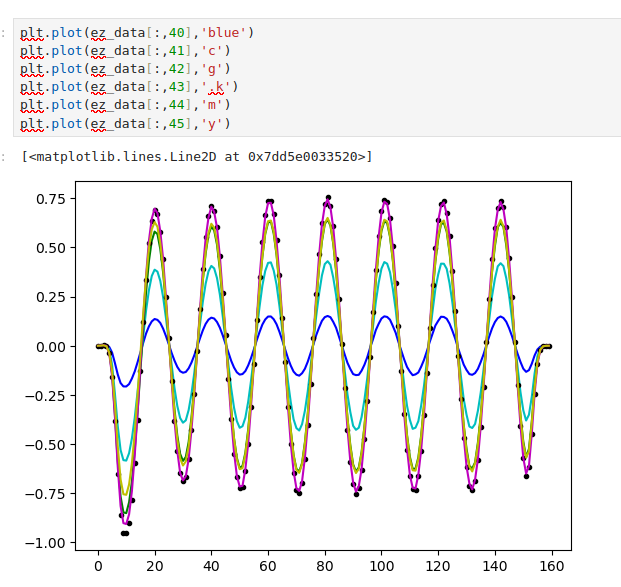
# From the Meep tutorial: plotting permittivity and fields of a straight waveguide
import meep as mp

cell = mp.Vector3(16, 8, 0)

geometry = [
    mp.Block(
        mp.Vector3(mp.inf, 1, mp.inf),
        center=mp.Vector3(),
        material=mp.Medium(epsilon=12),
    )
]

sources = [
    mp.Source(
        mp.ContinuousSource(frequency=0.15), component=mp.Ez, center=mp.Vector3(-7, 0)
    )
]

pml_layers = [mp.PML(1.0)]

resolution = 10

sim = mp.Simulation(
    cell_size=cell,
    boundary_layers=pml_layers,
    geometry=geometry,
    sources=sources,
    resolution=resolution,
)

sim.run(until=200)
Ahi el programa corre, para visualizar tenemos
import matplotlib.pyplot as plt
import numpy as np

eps_data = sim.get_array(center=mp.Vector3(), size=cell, component=mp.Dielectric)
plt.figure()
plt.imshow(eps_data.transpose(), interpolation="spline36", cmap="binary")
plt.axis("off")
plt.show()

ez_data = sim.get_array(center=mp.Vector3(), size=cell, component=mp.Ez)
plt.figure()
plt.imshow(eps_data.transpose(), interpolation="spline36", cmap="binary")
plt.imshow(ez_data.transpose(), interpolation="spline36", cmap="RdBu", alpha=0.9)
plt.axis("off")
plt.show()

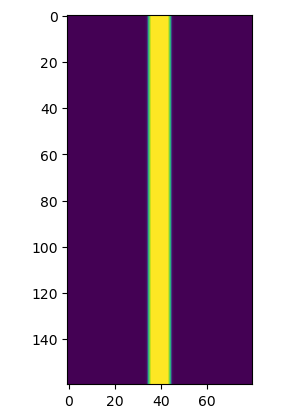
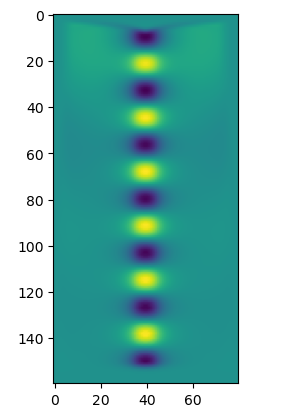
Es muy interesante darse cuenta de que ya tenemos los datos de la funcion dielectrica en python y los podemos visualizar haciendo
plt.imshow(eps_data)
plt.imshow(ez_data)
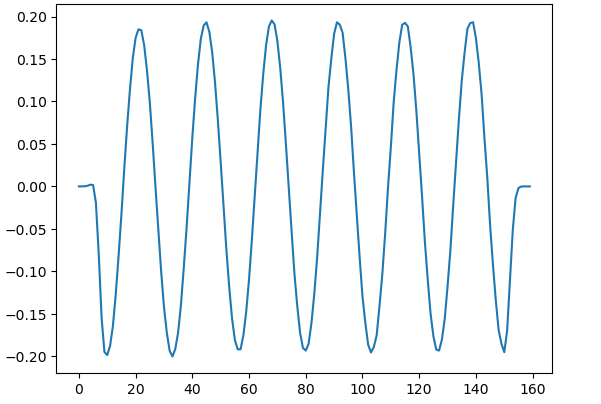
plt.plot(ez_data[:,40])
Vamos a entender la relacion de dispersion
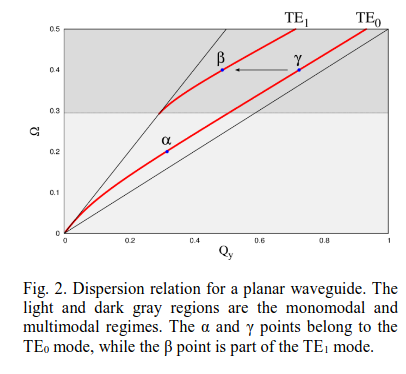
Esta es una guia de ![]() en aire (
en aire (![]() ).
).
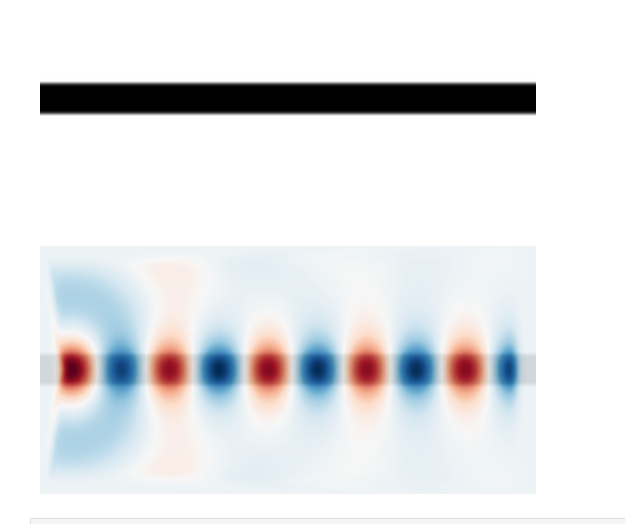
import meep as mp
cell = mp.Vector3(16, 8, 0)
geometry = [mp.Block(mp.Vector3(mp.inf, 1, mp.inf),center=mp.Vector3(),material=mp.Medium(epsilon=4),)]
sources = [mp.Source(mp.ContinuousSource(frequency=0.2), component=mp.Ez, center=mp.Vector3(-7, 0))]
pml_layers = [mp.PML(1.0)]
resolution = 10
sim = mp.Simulation(cell_size=cell,boundary_layers=pml_layers,geometry=geometry,sources=sources,resolution=resolution,)
sim.run(until=200)
import matplotlib.pyplot as plt
import numpy as np

eps_data = sim.get_array(center=mp.Vector3(), size=cell, component=mp.Dielectric)
plt.figure()
plt.imshow(eps_data.transpose(), interpolation="spline36", cmap="binary")
plt.axis("off")
plt.show()

ez_data = sim.get_array(center=mp.Vector3(), size=cell, component=mp.Ez)
plt.figure()
plt.imshow(eps_data.transpose(), interpolation="spline36", cmap="binary")
plt.imshow(ez_data.transpose(), interpolation="spline36", cmap="RdBu", alpha=0.9)
plt.axis("off")
plt.show()
plt.plot(ez_data[:,40])
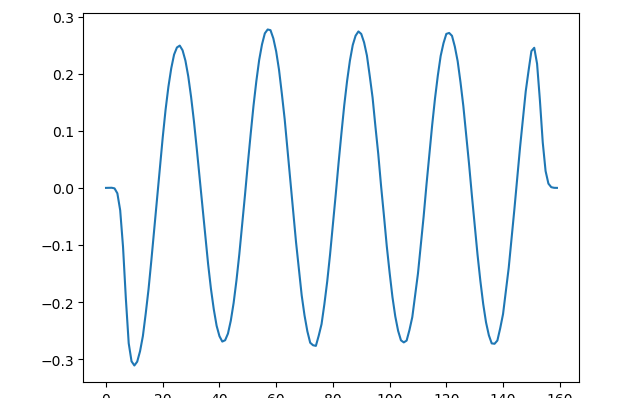
Para el modo en ![]() tenemos que
tenemos que ![]() , considerando que
, considerando que
![]()
![]()
![]()
Para el caso de ![]() tenemos
tenemos ![]()
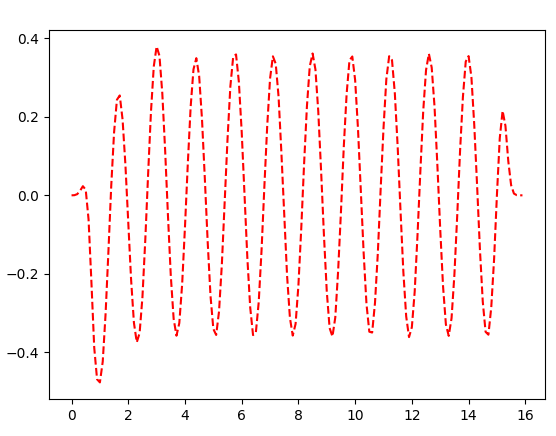
Para poder medir la distancia entre valle y valle (o cresta y cresta), hacemos
f = open("python.dat","w")
for i in range(ez_data.shape[0]):
 print(i,ez_data[i,40])
 f.write(str(i/10.0)+" "+str(ez_data[i,40])+"\n")
f.close()
El siguiente codigo se llama lee.py y se corre en el sistema operativo para que se genere una grafica en donde con el mouse, se pueda medir las distancias
import numpy  as np
import matplotlib.pyplot as plt
data = np.loadtxt('python.dat')
x = data[:, 0]
y = data[:, 1]
plt.plot(x, y,'r--')
plt.show()
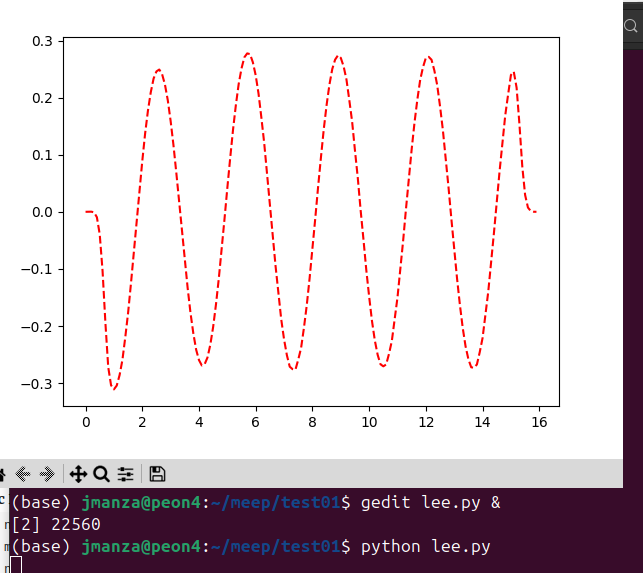
Cuando ![]() , tenemos
, tenemos ![]() , nos sale
, nos sale ![]() la longitud de onda, que e slo que vemos
la longitud de onda, que e slo que vemos
Podemos generar el segundo modo
# From the Meep tutorial: plotting permittivity and fields of a straight waveguide
import meep as mp
cell = mp.Vector3(16, 8, 0)
geometry = [mp.Block(mp.Vector3(mp.inf, 1, mp.inf),center=mp.Vector3(),material=mp.Medium(epsilon=4),)]
sources = [mp.Source(mp.ContinuousSource(frequency=0.4), component=mp.Ez, center=mp.Vector3(-7,  0.4),amplitude=+1.0),
           mp.Source(mp.ContinuousSource(frequency=0.4), component=mp.Ez, center=mp.Vector3(-7, -0.4),amplitude=-1.0)]
pml_layers = [mp.PML(1.0)]
resolution = 10
sim = mp.Simulation(cell_size=cell,boundary_layers=pml_layers,geometry=geometry,sources=sources,resolution=resolution,)
sim.run(until=200)

import matplotlib.pyplot as plt
import numpy as np

eps_data = sim.get_array(center=mp.Vector3(), size=cell, component=mp.Dielectric)
plt.figure()
plt.imshow(eps_data.transpose(), interpolation="spline36", cmap="binary")
plt.axis("off")
plt.show()

ez_data = sim.get_array(center=mp.Vector3(), size=cell, component=mp.Ez)
plt.figure()
plt.imshow(eps_data.transpose(), interpolation="spline36", cmap="binary")
plt.imshow(ez_data.transpose(), interpolation="spline36", cmap="RdBu", alpha=0.9)
plt.axis("off")
plt.show()
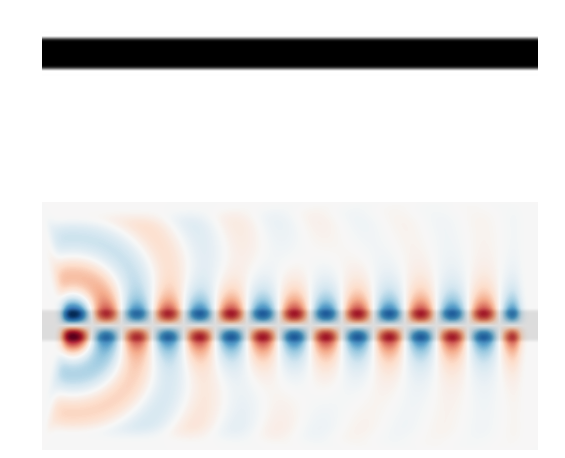
Podemos checar que la maxima amplitud NO esta en el centro
