import meep as mp
L = 40
H = 2
t_until=400
cell = mp.Vector3(2*L, L, 0)
geometry = [mp.Block(mp.Vector3(L,  1, mp.inf),center=mp.Vector3(-L/2,-H/2),material=mp.Medium(epsilon=3.6*3.6),e1=[1.0, 0.0],e2=[0.0, 1.0]),
            mp.Block(mp.Vector3(1,H+1, mp.inf),center=mp.Vector3(   0,   0),material=mp.Medium(epsilon=3.6*3.6),e1=[1.0, 0.0],e2=[0.0, 1.0]),
            mp.Block(mp.Vector3(L,  1, mp.inf),center=mp.Vector3(+L/2,+H/2),material=mp.Medium(epsilon=3.6*3.6),e1=[1.0, 0.0],e2=[0.0, 1.0])]
sources = [mp.Source(mp.ContinuousSource(frequency=0.1), component=mp.Ez, center=mp.Vector3(-L+2, -H/2))]
pml_layers = [mp.PML(1.0)]
resolution = 10
sim = mp.Simulation(cell_size=cell,boundary_layers=pml_layers,geometry=geometry,sources=sources,resolution=resolution,)
from matplotlib import pyplot as plt
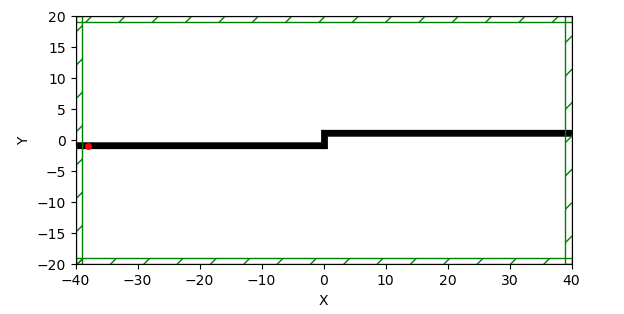
plt.figure(dpi=100)
sim.plot2D()
plt.savefig('books_read'+str(H)+'.png')
plt.show()
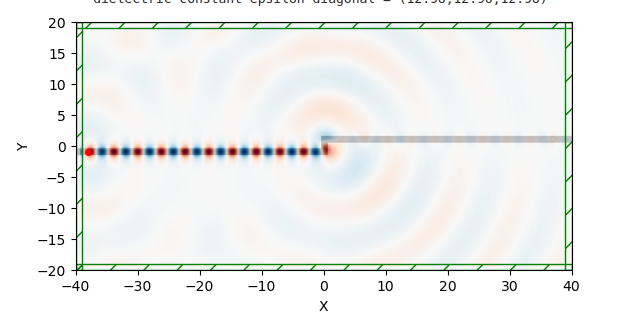
sim.run(until=t_until)
plt.figure(dpi=100)
sim.plot2D(fields=mp.Ez)
plt.show()
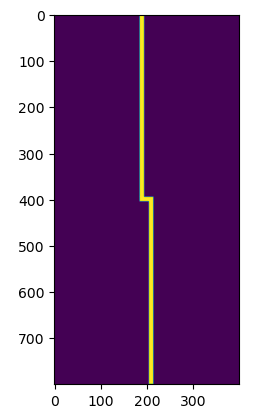
eps_data = sim.get_array(center=mp.Vector3(), size=cell, component=mp.Dielectric)
ez_data = sim.get_array(center=mp.Vector3(), size=cell, component=mp.Ez)
plt.figure()
plt.imshow(eps_data, interpolation='spline36', cmap='binary')
plt.imshow(ez_data, interpolation='spline36', cmap='RdBu', alpha=0.9)
plt.axis('off')
plt.show()
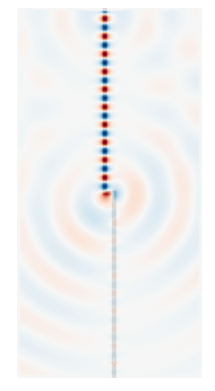
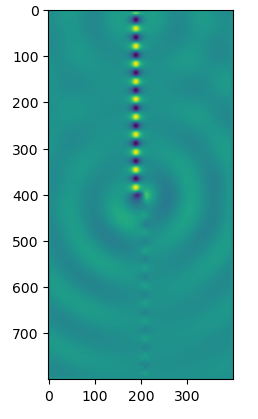
plt.imshow(ez_data)
plt.imshow(eps_data)