import numpy as np
import matplotlib.pyplot as plt
import math
N = 20
t = np.zeros(N)
x = np.zeros(N)
y = np.zeros(N)
g = 9.8
v0 = 100.0
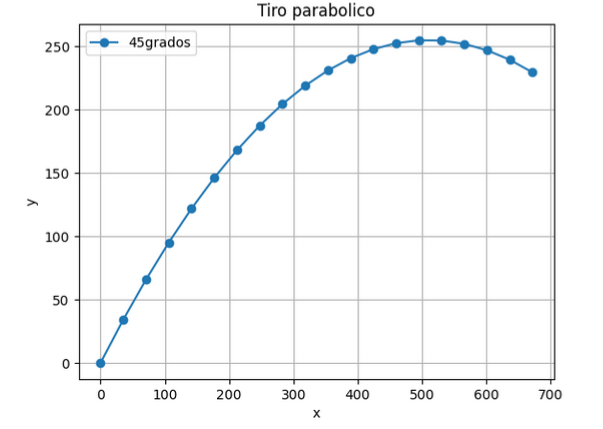
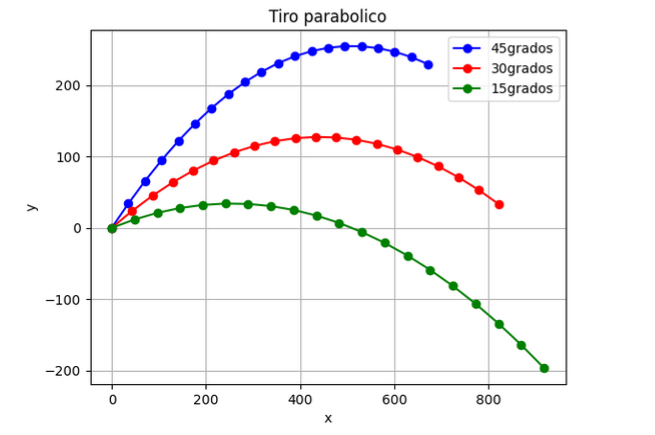
ang = 45.0
x0 = 0.0
y0 = 0.0
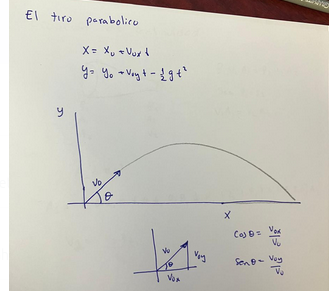
v0x = v0*math.cos(ang*(math.pi/180))
v0y = v0*math.sin(ang*(math.pi/180))
ti = 0.0
tf = 10.0
dt = (tf-ti)/N
for it in range(0,N):
t[it]=ti+it*dt
x[it]=x0+v0x*t[it]
y[it]=y0+v0y*t[it]-0.5*g*t[it]*t[it]
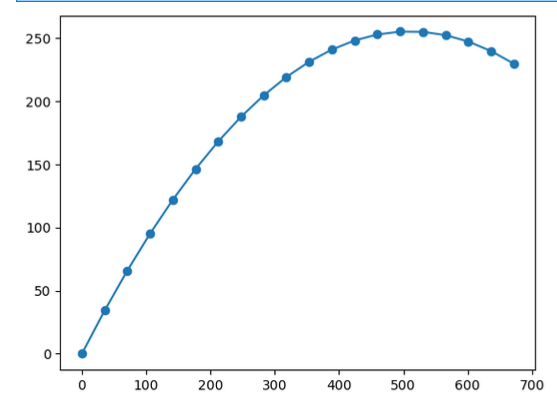
plt.plot(x,y,'-o')
plt.show()