Comenzamos con las librerias
import numpy as np
import matplotlib.pyplot as plt
from random import *
import math
Creamos la funcion lienas
def lineas():

 xv=np.array([0,16])
 yv=np.array([0,0])
 plt.plot(xv,yv,'-k')

 xv=np.array([0,16])
 yv=np.array([25,25])
 plt.plot(xv,yv,'-k')

 xv=np.array([0,0])
 yv=np.array([0,25])
 plt.plot(xv,yv,'-k')

 xv=np.array([16,16])
 yv=np.array([0,25])
 plt.plot(xv,yv,'-k')

 xv=np.array([0,16])
 yv=np.array([0,0])
 plt.plot(xv,yv,'-k')

 xv=np.array([0,16])
 yv=np.array([25,25])
 plt.plot(xv,yv,'-k')

 xv=np.array([0,16])
 yv=np.array([6,6])
 plt.plot(xv,yv,'-b')

 xv=np.array([0,16])
 yv=np.array([12,12])
 plt.plot(xv,yv,'-b')

 xv=np.array([0,16])
 yv=np.array([18,18])
 plt.plot(xv,yv,'-b')

 xv=np.array([0,16])
 yv=np.array([24,24])
 plt.plot(xv,yv,'-b')
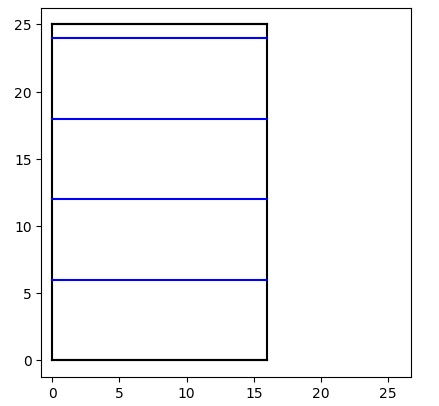
se corre con
lineas()
plt.axis('square')
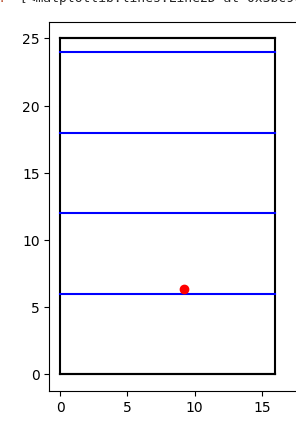
Para ubicar un punto aleatorio en la hoja hacemos
lineas()
plt.axis('square')

x=random()*16
y=random()*25
plt.plot(x,y,'or')
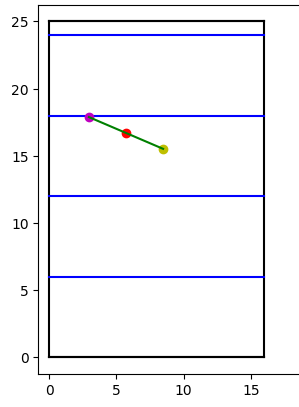
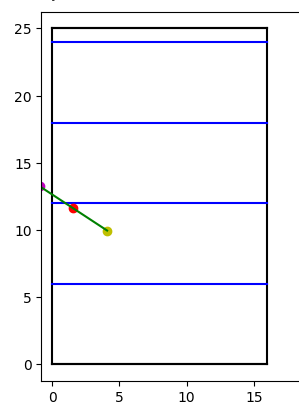
Para poner un picadientes en forma aleatoria hacemos
lineas()
plt.axis('square')

x=random()*16
y=random()*25
plt.plot(x,y,'or')

l=6
theta1=180*random()

theta2=theta1*(math.pi/180.0)

x1 = (l/2)*math.cos(theta2)
y1 = (l/2)*math.sin(theta2)
plt.plot(x+x1,y+y1,'om')
plt.plot(x-x1,y-y1,'oy')
xv=np.array([x-x1,x+x1])
yv=np.array([y-y1,y+y1])
plt.plot(xv,yv,'-g')
Para saber que la aguja toca una linea hacemos
lineas()
plt.axis('square')

x=random()*16
y=random()*25
plt.plot(x,y,'or')

l=6
theta1=180*random()

theta2=theta1*(math.pi/180.0)

x1 = (l/2)*math.cos(theta2)
y1 = (l/2)*math.sin(theta2)
plt.plot(x+x1,y+y1,'om')
plt.plot(x-x1,y-y1,'oy')
xv=np.array([x-x1,x+x1])
yv=np.array([y-y1,y+y1])
plt.plot(xv,yv,'-g')

if y-y1 < 0*6 and y+y1>0*6:
    print('toca y=0')

if y-y1 < 1*6 and y+y1>1*6:
    print('toca y=1*6')

if y-y1 < 2*6 and y+y1>2*6:
    print('toca y=2*6')

if y-y1 < 3*6 and y+y1>3*6:
    print('toca y=3*6')

if y-y1 < 4*6 and y+y1>4*6:
    print('toca y=4*6')
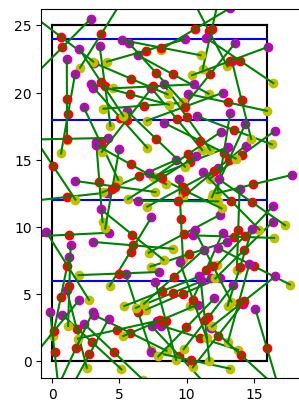
Para contar el numero de veces que se tocan las lineas en un experimento de 100 repeticiones se hace
lineas()
plt.axis('square')
toco=0
N=100
for i in range(N):
x=random()*16
y=random()*25
plt.plot(x,y,'or')
l=6
theta1=180*random()
theta2=theta1*(math.pi/180.0)
x1 = (l/2)*math.cos(theta2)
y1 = (l/2)*math.sin(theta2)
plt.plot(x+x1,y+y1,'om')
plt.plot(x-x1,y-y1,'oy')
xv=np.array([x-x1,x+x1])
yv=np.array([y-y1,y+y1])
plt.plot(xv,yv,'-g')
if y-y1 < 0*6 and y+y1>0*6:
print('toca y=0')
toco=toco+1
if y-y1 < 1*6 and y+y1>1*6:
print('toca y=1*6')
toco=toco+1
if y-y1 < 2*6 and y+y1>2*6:
print('toca y=2*6')
toco=toco+1
if y-y1 < 3*6 and y+y1>3*6:
print('toca y=3*6')
toco=toco+1
if y-y1 < 4*6 and y+y1>4*6:
print('toca y=4*6')
toco=toco+1
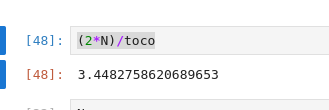
print(toco)
El caclulo de pi se hace con