import numpy as np
import math
import cmath
import matplotlib.pyplot as plt
im = complex(0.0,1.0)
# Si
ka  = 150.0
ca  = 710.0
ra  = 2330.0
ta  = 150.0e-12
CCa = math.sqrt(ka/(ra*ca*ta))
#Ge
kb  = 60.0
cb  = 310.0
rb  = 5300.0
tb  = 200.0e-12
CCb = math.sqrt(kb/(rb*cb*tb))
Nf    =    1000
fi    =    0
ff    =    800.0e9
df    =    (ff-fi)/Nf
f     =    np.zeros(Nf)
aux   =    np.zeros(Nf,dtype=complex)
l  = 2.0e-9
######################
fa = 0.5
la  = fa*l
lb  = l-la
for cf in range(1,Nf):
  f[cf]= fi+cf*df
  w    = 2.0*math.pi*f[cf]
  ga   = cmath.sqrt((w*w+im*(w/ta))/(CCa*CCa))
  gb   = cmath.sqrt((w*w+im*(w/tb))/(CCb*CCb))
  na   = ka/(1-im*w*ta)
  nb   = kb/(1-im*w*tb)
  aux1 = cmath.cosh(im*ga*la)*cmath.cosh(im*gb*lb)
  aux2 = ( (na*ga)/(nb*gb) + (nb*gb)/(na*ga) )
  aux3 = cmath.sinh(im*ga*la)*cmath.sinh(im*gb*lb)
  aux4 = aux1+0.5*aux2*aux3
  aux[cf] = cmath.acos(aux4)
######################
Esta es la Fig 3 de este paper
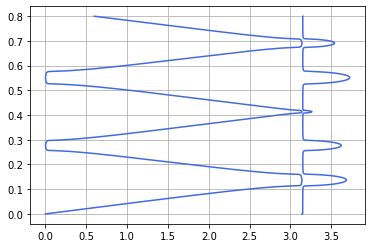
plt.grid()
plt.plot(aux.real,f/1e12,'royalblue',3.14+abs(aux.imag),f/1e12,'royalblue')
plt.show()