import matplotlib.pyplot as plt
import numpy as np
import math
L = 0.1 # 10 cm
Nx = 100
xi = 0.0
xf = L
dx = (xf-xi)/Nx
x = np.zeros(Nx+1)
T = np.zeros(Nx+1)
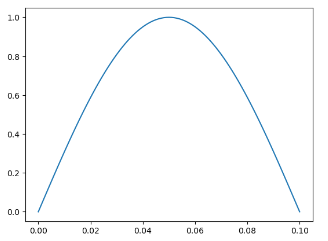
T0 = 1.0
k = math.pi/L
for ix in range(0,Nx+1):
x[ix] = xi + ix*dx
T[ix] = T0*math.sin(k*x[ix])
plt.plot(x,T)
plt.show()
import matplotlib.pyplot as plt
import numpy as np
import math
D = 9.7e-5
L = 0.1 # 10 cm
alfa = D*(math.pi/L)**2
Nx = 100
xi = 0.0
xf = L
dx = (xf-xi)/Nx
x = np.zeros(Nx+1)
TT0 = np.zeros(Nx+1)
TT1 = np.zeros(Nx+1)
TT2 = np.zeros(Nx+1)
TT3 = np.zeros(Nx+1)
T0 = 1.0
k = math.pi/L
t0 = 0.0
t1 = 1.0
t2 = 2.0
t3 = 3.0
for ix in range(0,Nx+1):
x[ix] = xi + ix*dx
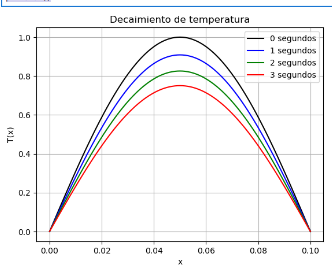
TT0[ix] = T0*math.sin(k*x[ix])*math.exp(-alfa*t0)
TT1[ix] = T0*math.sin(k*x[ix])*math.exp(-alfa*t1)
TT2[ix] = T0*math.sin(k*x[ix])*math.exp(-alfa*t2)
TT3[ix] = T0*math.sin(k*x[ix])*math.exp(-alfa*t3)
plt.plot(x,TT0,'-k',label='0 segundos')
plt.plot(x,TT1,'-b',label='1 segundos')
plt.plot(x,TT2,'-g',label='2 segundos')
plt.plot(x,TT3,'-r',label='3 segundos')
plt.xlabel("x")
plt.ylabel("T(x)")
plt.title('Decaimiento de temperatura')
plt.legend()
plt.grid()
plt.show()
import matplotlib.pyplot as plt
import numpy as np
import math

D      = 9.7e-5
L      = 0.1         # 10 cm
alfa   = D*(math.pi/L)**2
Nx     = 100
xi     = 0.0
xf     = L
dx     = (xf-xi)/Nx
x      = np.zeros(Nx+1)
TT0      = np.zeros(Nx+1)


T0     = 1.0
k      = math.pi/L

for it in range(0,10):
 t=it*1.0
 for ix in range(0,Nx+1):
  x[ix]  = xi + ix*dx
  TT0[ix]  = T0*math.sin(k*x[ix])*math.exp(-alfa*t)
 plt.xlabel("x")
 plt.ylabel("T(x)")
 plt.title('Decaimiento de temperatura')
 plt.grid()
 plt.plot(x,TT0,label='tempe')
 plt.ylim(0,1)
 plt.legend()
 if it<  10                  : plt.savefig("Temp0{}.png".format(it))
 plt.close()